1.0 Introduction
The Kenya’s Great Rift Valley lakes are famous for pink flamingo, wildlife parks, herds of wildebeest and other archeological sites. However, most of these lakes in the region have swollen to the highest records and overflown in the recent years displacing thousands of people from their homes, leaving behind submerged schools, health facilities, social amenities and rendering some of the public infrastructure like roads impassable.
Observation shows that Lake Naivasha, Elementaita, Nakuru, Bogoria and Baringo have been rising since 2018, and for the past two years, the levels have superseded the 2012-2013 records to levels not seen in the past 50 years. This phenomena has significantly impacted the tourism industry, an important sector in the Kenyan economy. The lakes and their associated wetlands play significant roles which include: maintenance of aquatic biodiversity and ecosystem function; climate modulation; provision of ecosystem goods and services; provision of water and food for humans and other living organisms; flood regulation; water quality regulation and buffering and groundwater recharge. Most of these lakes are also UNESCO World Heritage Sites due to their outstanding universal values and they are also designated Ramsar sites (wetlands of international importance) and Important Bird Areas (IBAs).
There are several hypotheses being advanced to explain the hydrological imbalance observed in these lakes, resulting in submerged buildings and infrastructure, displacement of both humans and wildlife. We use geospatial and remote sensing technologies to extract time series of spatial extent and area of major of Rift Valley lakes in Kenya based on analysis of satellite images (Landsat 8) from May 2013 to October 2020. The lake spatial extent time series information were overlaid with the satellite derived lake catchment rainfall (CHIRPS) over a similar time period. The aim of the exercise was to examine the evolution of lake spatial extent (lake surface area) over time and establish any correlation between the increasing lake surface area and rainfall within the lake catchment area.
1.1 Lake Naivasha
Lake Naivasha is a freshwater lake located at the highest elevation of the Kenyan Rift valley at 1,884m above mean sea level with a documented surface area of about 139 km2 and catchment area of about 2,380km2. Apart from several transient streams, the lake is fed by the perennial Malewa and Gilgil rivers with no visible outlets, but due to its relatively freshwater nature it is assumed to have an underground outflow. Since 2018, the lake level has risen and increased in spatial extent by about 10% now covering about 155km2. Figure 1, show distinct satellite images of the lake area extent derived from the Landsat 8 image of July 2013 and October 2020. The time series of lake surface areas extent is overlaid with the lake catchment areal rainfall (Figure 2) and deviations from long term mean of 2013 -2020 (143km2) in Figure 3.
The increase of lake extent coincides with the increase in lake catchment areal rainfall. In 2018 and 2019, the lake catchment areal rainfall were 65% and 21% above normal respectively (Figure 2 and 3). The 2020 rainfall is already 5% above normal and KMD has forecast a depressed rainfall for October-December (OND).
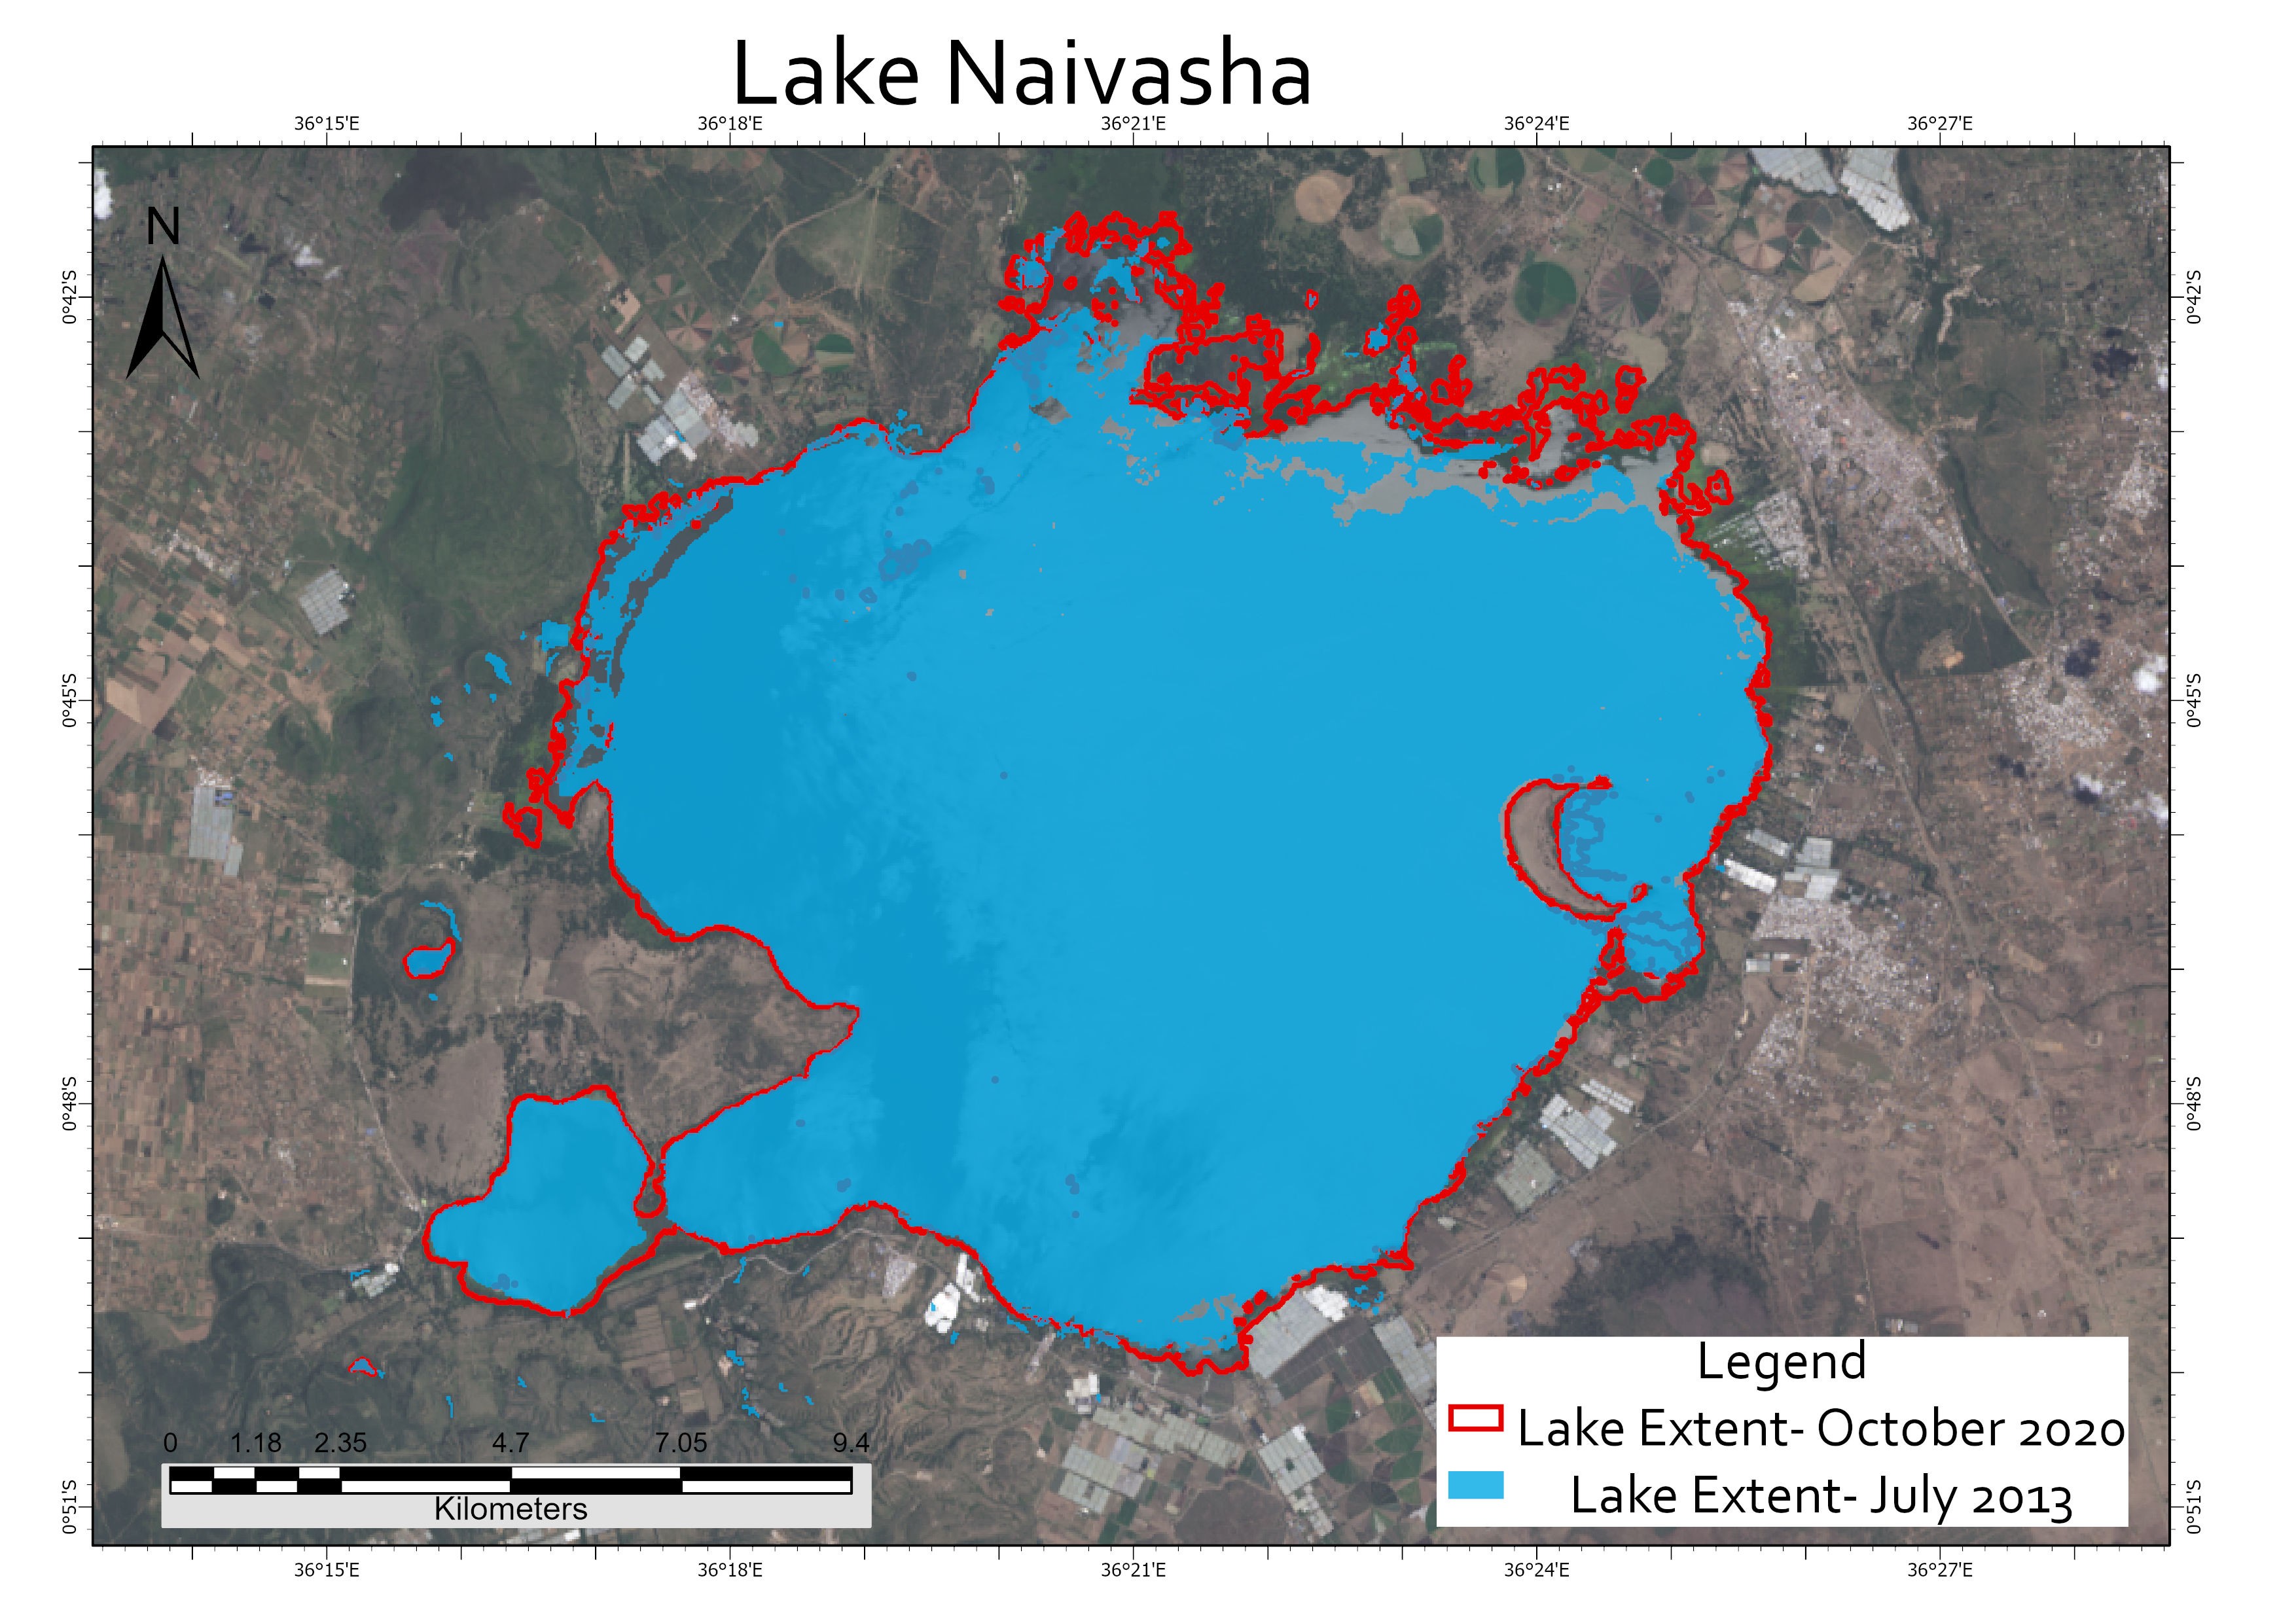
Figure 1: Comparison of Lake Naivasha’ surface extents in 2013 and 2020. Source: Landsat 8
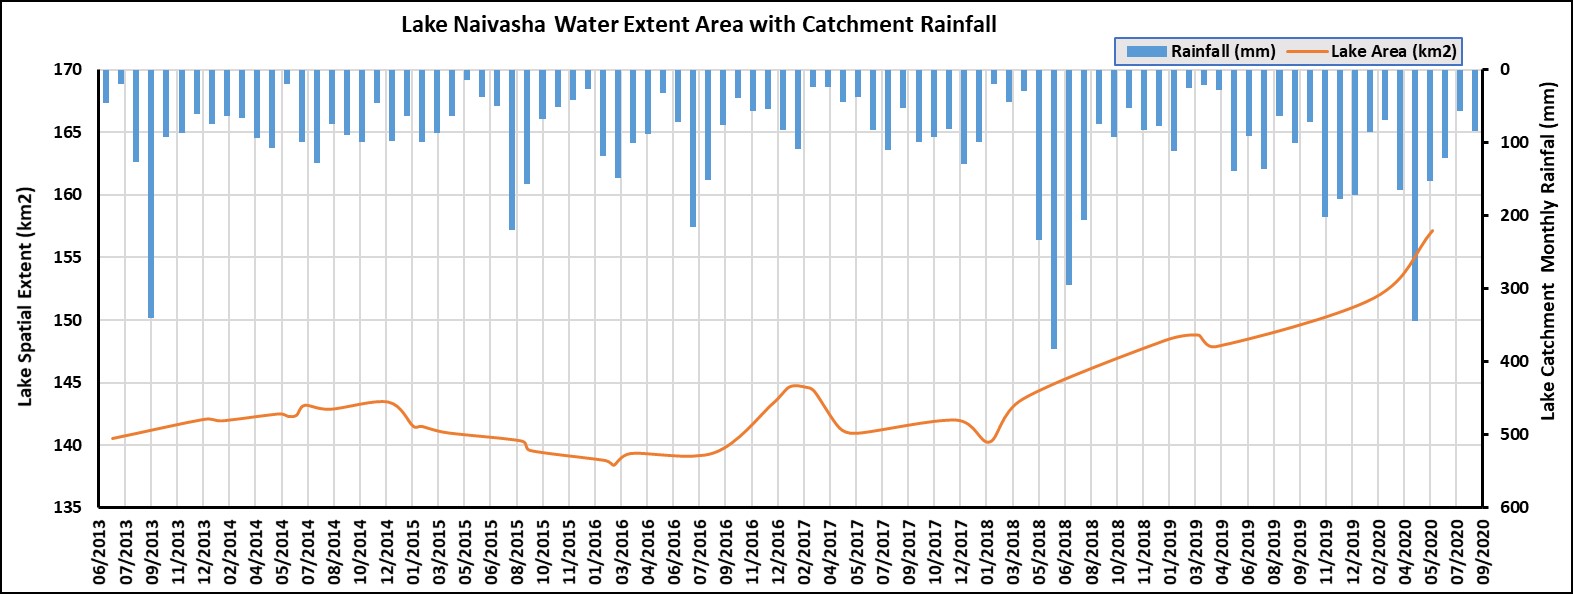
Figure 2: Evolution of Lake Naivasha’s surface area, compared to catchment rainfall (CHIRPS) over time
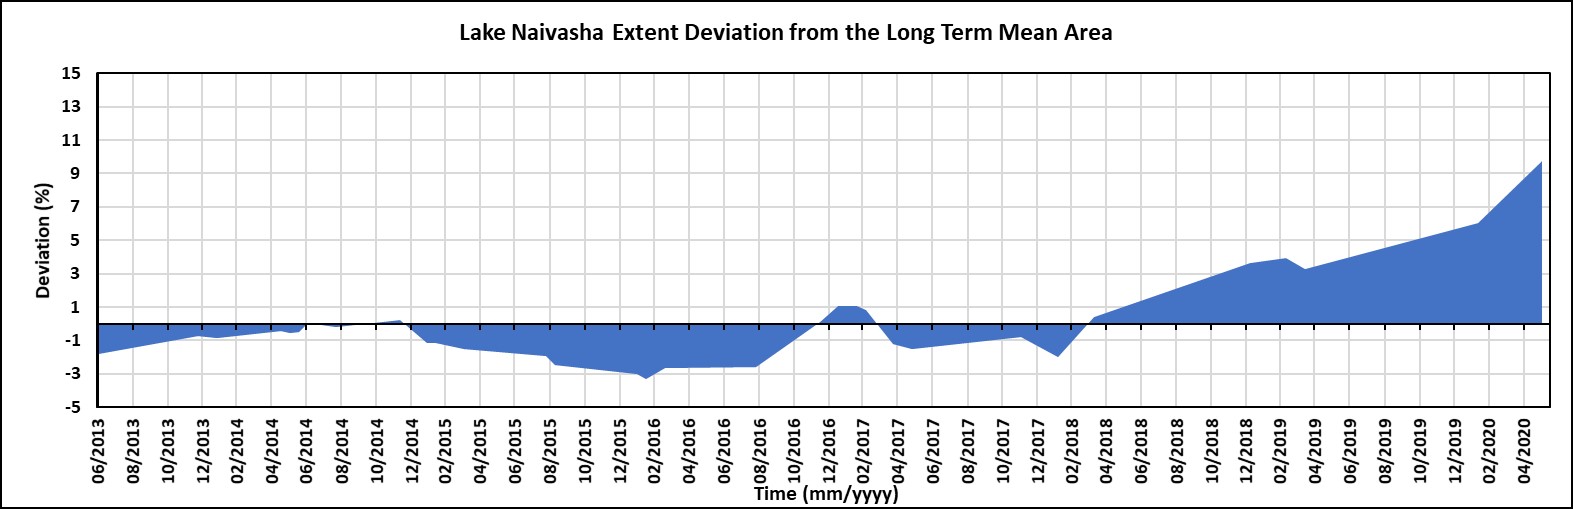
Figure 3: Anomalies (deviation from long-term mean) of Lake Naivasha’s surface area
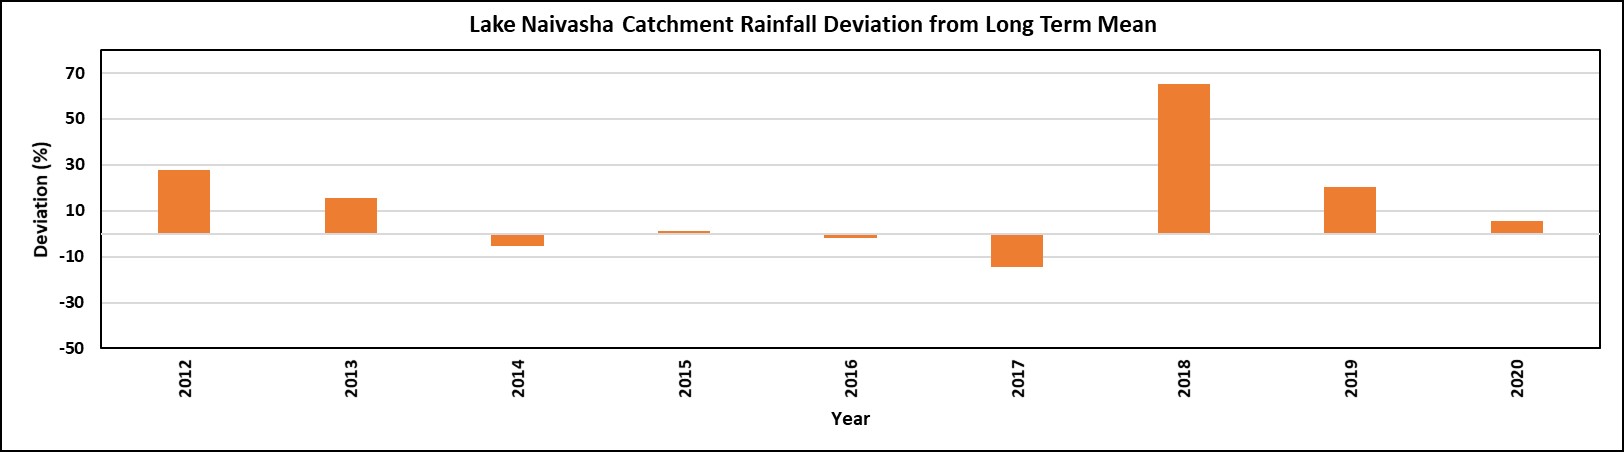
Figure 4: Anomalies of Lake Naivasha’s catchment rainfall (CHIRPS)
1.2 Lake Nakuru
Lake Nakuru is one of the Rift Valley soda lakes, located at an elevation of 1,754 m above sea level with mean surface area of about 47km2 and catchment areas of about 1760km2 with annual rainfall ranging from 800mm to 1500mm. It is protected by Lake Nakuru National Park, and contains high concentrations of algae that attract a large number of flamingos that line the lake’s shores. It is observed that the lake was once famous for its flamingos, however, since 2012, conditions have become unfavorable for the birds and most have moved to other Rift Valley lakes.
From estimations made using satellite image analysis, the lake surface area has increased by about 15% in the last two years to about 64km2 (Figure 5 and 6 below).
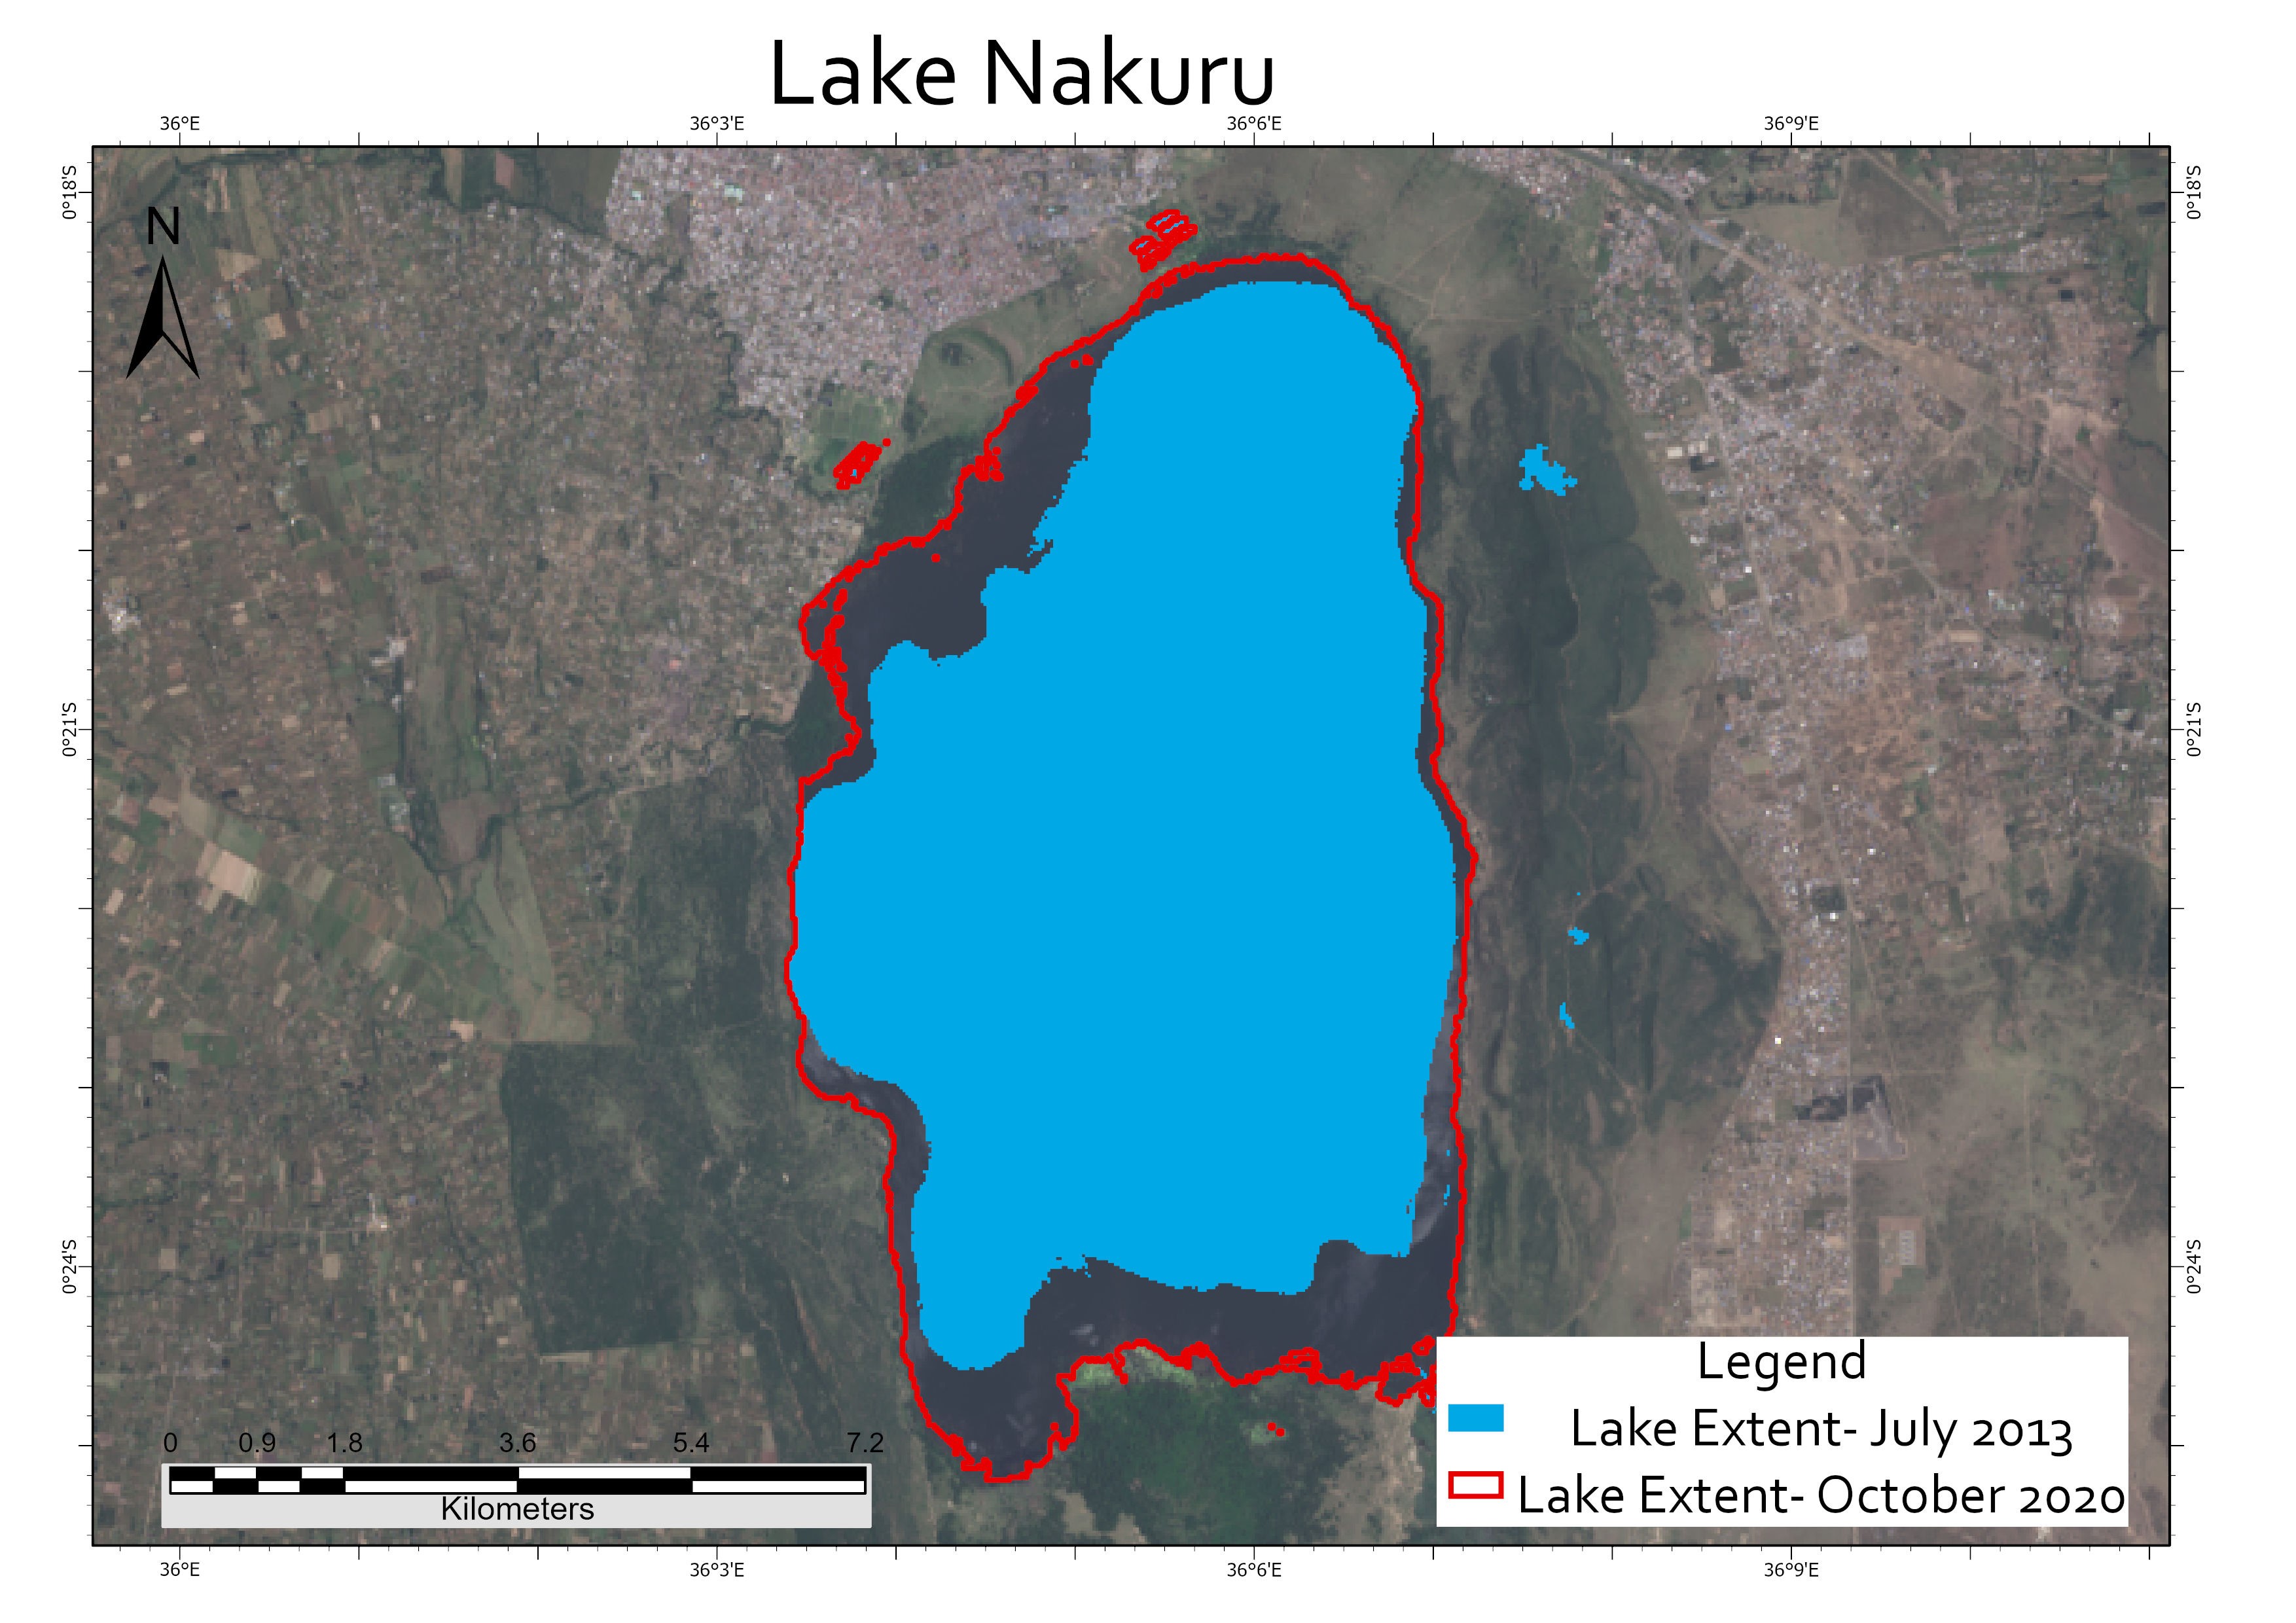
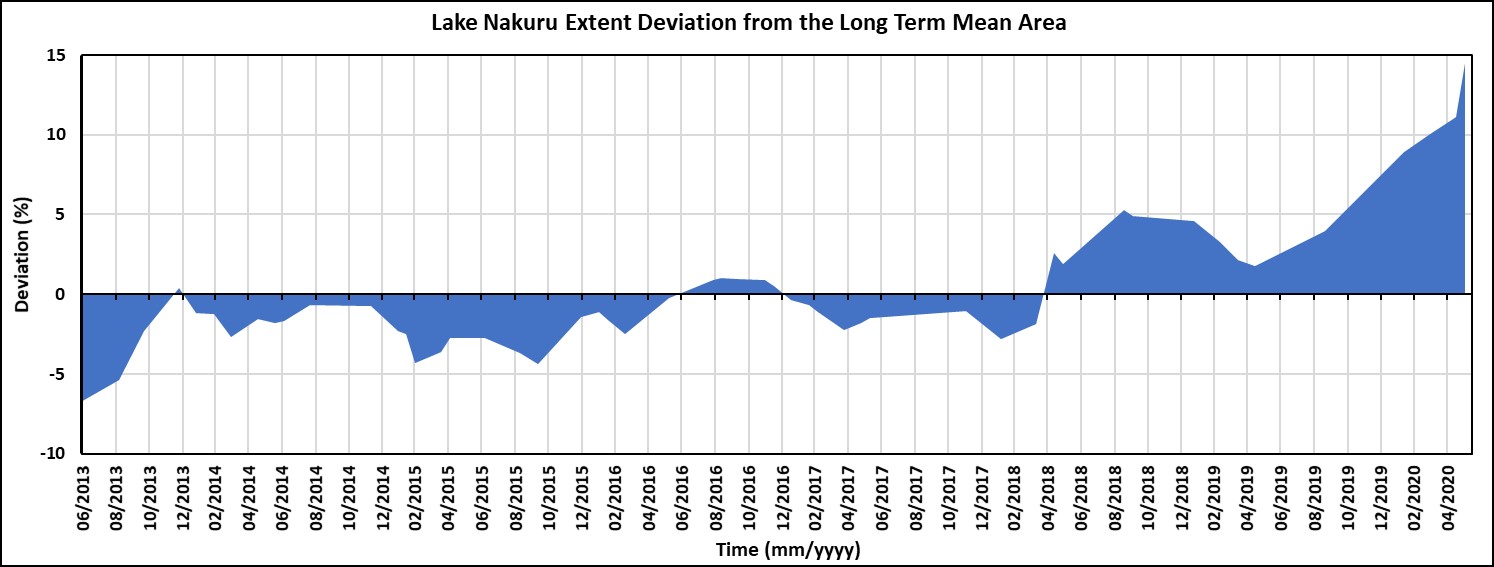
Figure 5 is a comparison of Lake Nakuru’ surface extents in 2013 and 2020. Source: Landsat 8 and Figure 6 shows Anomalies (deviation from long-term mean) of Lake Nakuru’s surface area
Just like Lake Naivasha, the increase coincides with the increase rainfall over the lake catchment with the significant increase in area seen in 2018 where the rainfall was 50% and 20% above normal (long term mean) in 2018 and 2019 respectively (Figure 7). In 2020 the catchment rainfall is already 3% above normal, notwithstanding the depressed rainfall predicted by KMD for October-December (OND).
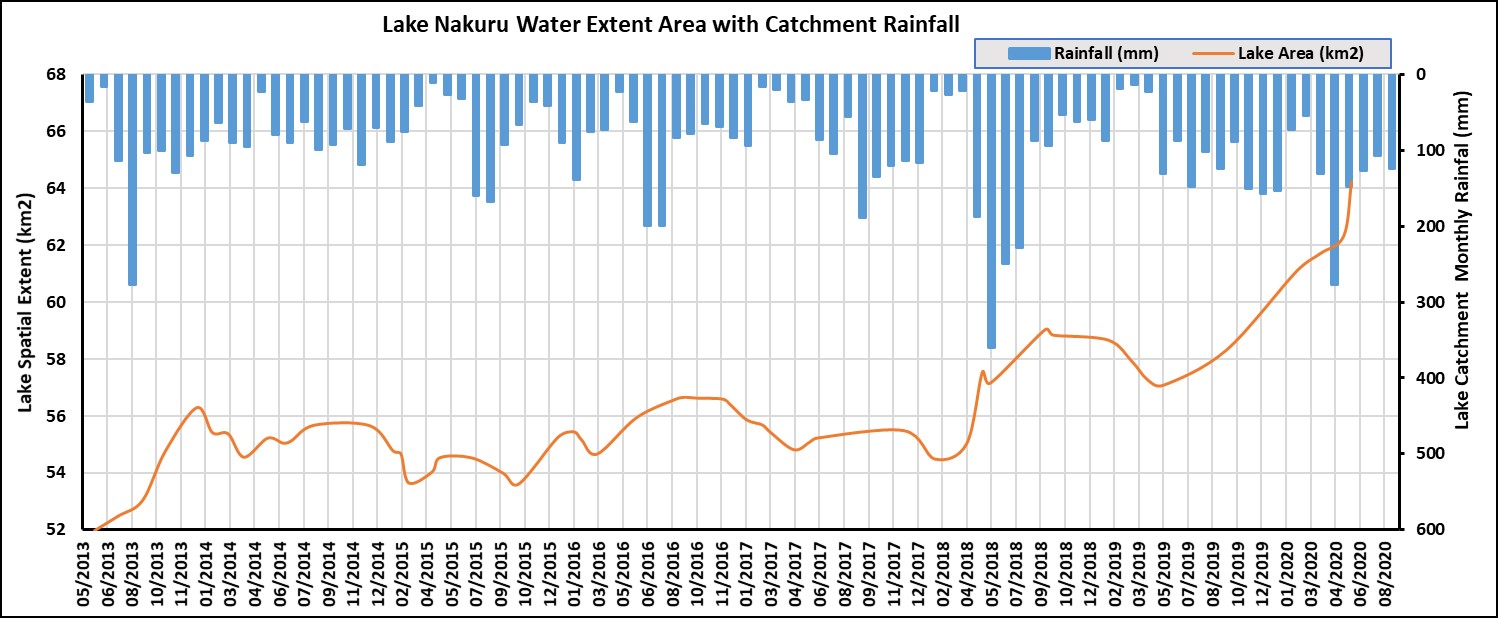
Figure 7 shows the evolution of Lake Nakuru’s lake surface area and catchment rainfall over time
1.3 Lake Bogoria
Lake Bogoria is a saline, alkaline lake and lies just south of Lake Baringo and home to one of the world's largest populations of lesser flamingoes and famed for hot springs and geysers due to active volcanic activities. The lake is a Ramsar Site and the Lake Bogoria National Reserve has been a protected area since the 1970. The lake has mean spatial area of about 39km2 and altitude of about 960m above mean see level with mean annual rainfall of about 1000mm over the catchment. The lake is in close proximity to Lake Baringo (less than 20km).
The lake surface area has increased minimally northward towards Lake Baringo by about 5% (1.68 linearly) from the long-term mean (Figure 8 and 9) with shoreline changes in some sections of the lake are remarkably observable from satellite imagery.
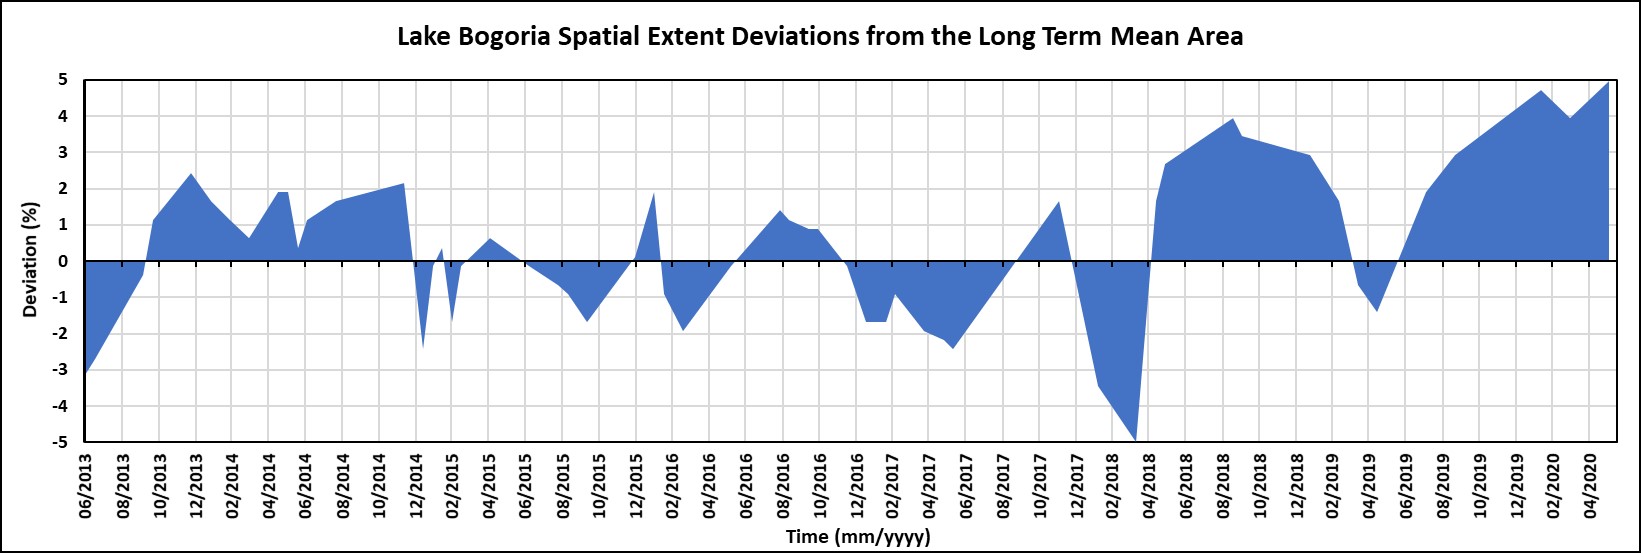
Figure 8 shows the Anomalies of Lake Bogoria’s surface area while Figure 9 is a comparison of shoreline change in Lake Bogoria. Source: Landsat 8.
In the last two years, rainfall over the catchment has significantly increased by 50% and 18% above normal in 2018 and 2019 respectively. The 2020 rainfall is already 19% above normal with the October December rainfall expected to be above normal too (Figure 10 and 11).
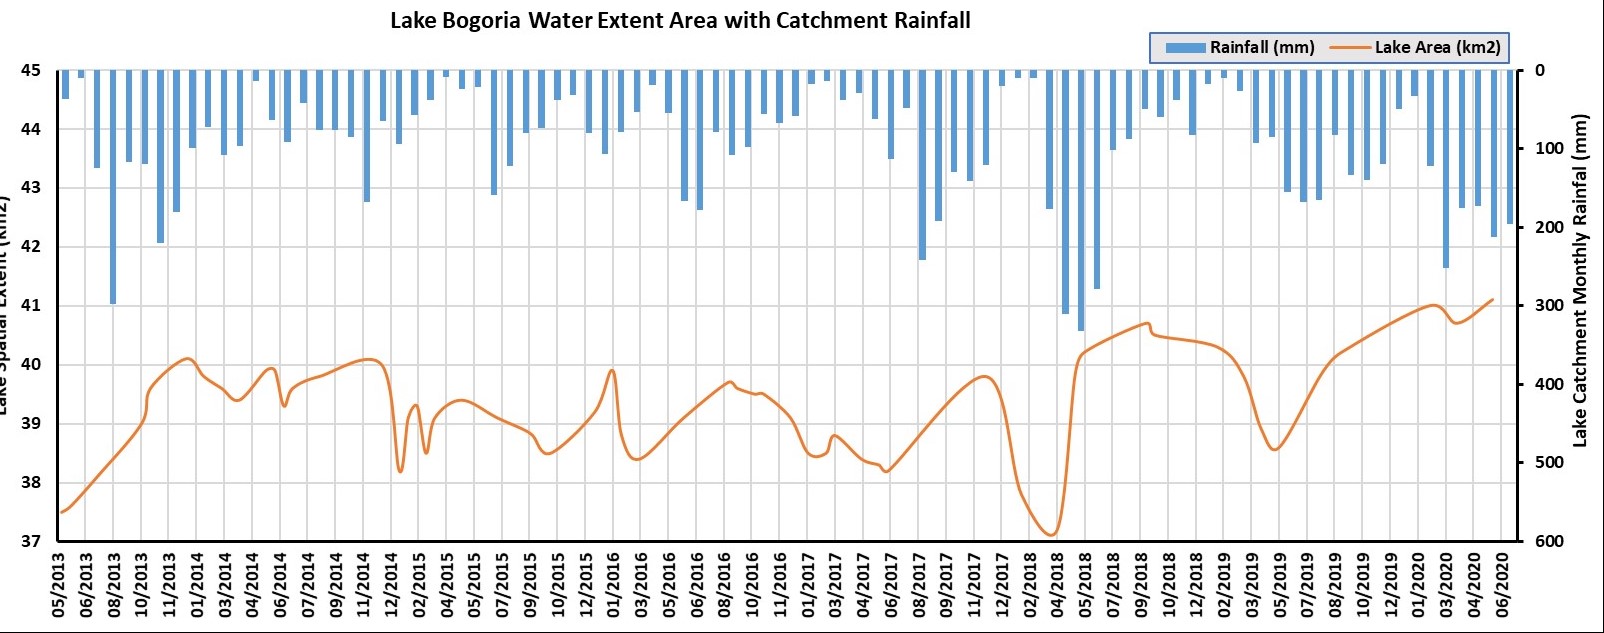
Figure 10 shows the trends of Lake Bogoria’s surface area and catchment rainfall evolution over time
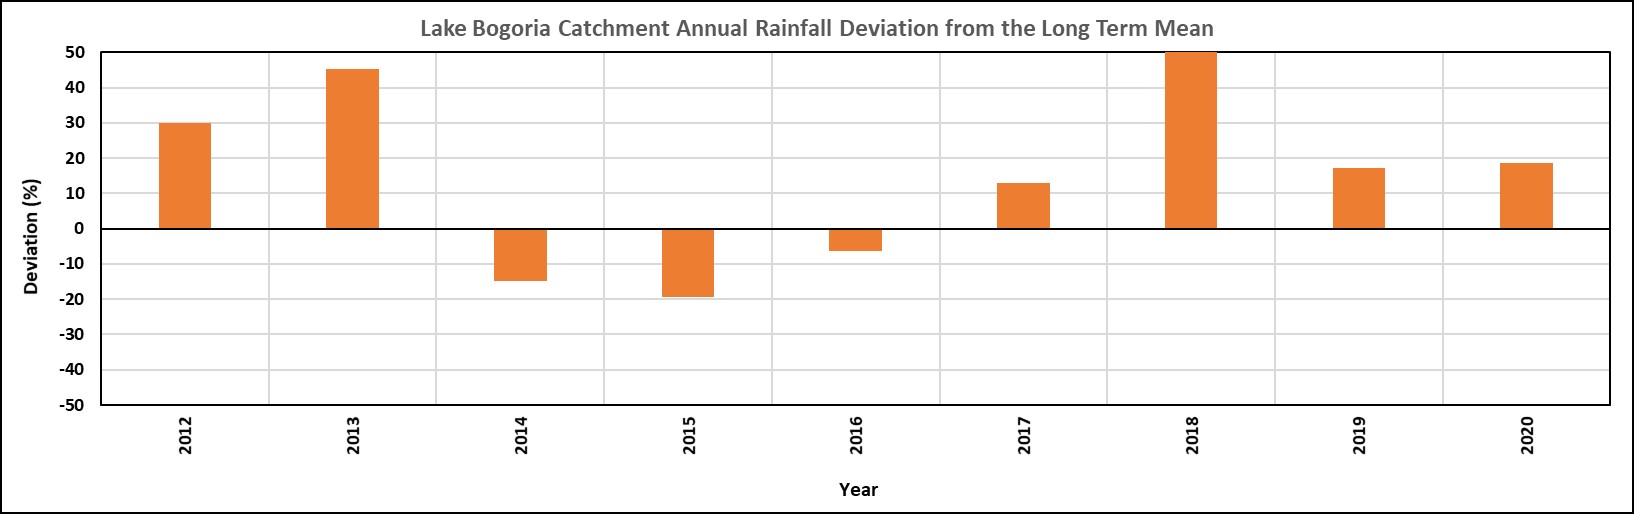
Figure 11:Shows the anomalies of Lake Bogoria’s catchment rainfall.
1.4 Lake Baringo
Lake Baringo is one of the two freshwater lakes in the Rift Valley in Kenya with an elevation of 970m above mean sea level and draining a catchment area of about 6,820 km2 with annual rainfall ranging from about 600mm to 1500mm. The lake is in close proximity to the saline Lake Bogoria and it is fed by perennial rivers Molo and Perkerra and other seasonal rivers of Ol Arabel, Makutan, Endoa and Chemeron. However, the lake has no observable outlet and the waters are assumed to seep through lake sediments into the faulted volcanic bedrock.
From the satellite image analysis, the lake surface extent has increased by about 6% in the last two years, majorly in the southward part where several rivers feed the lake
(Figure 12 and13).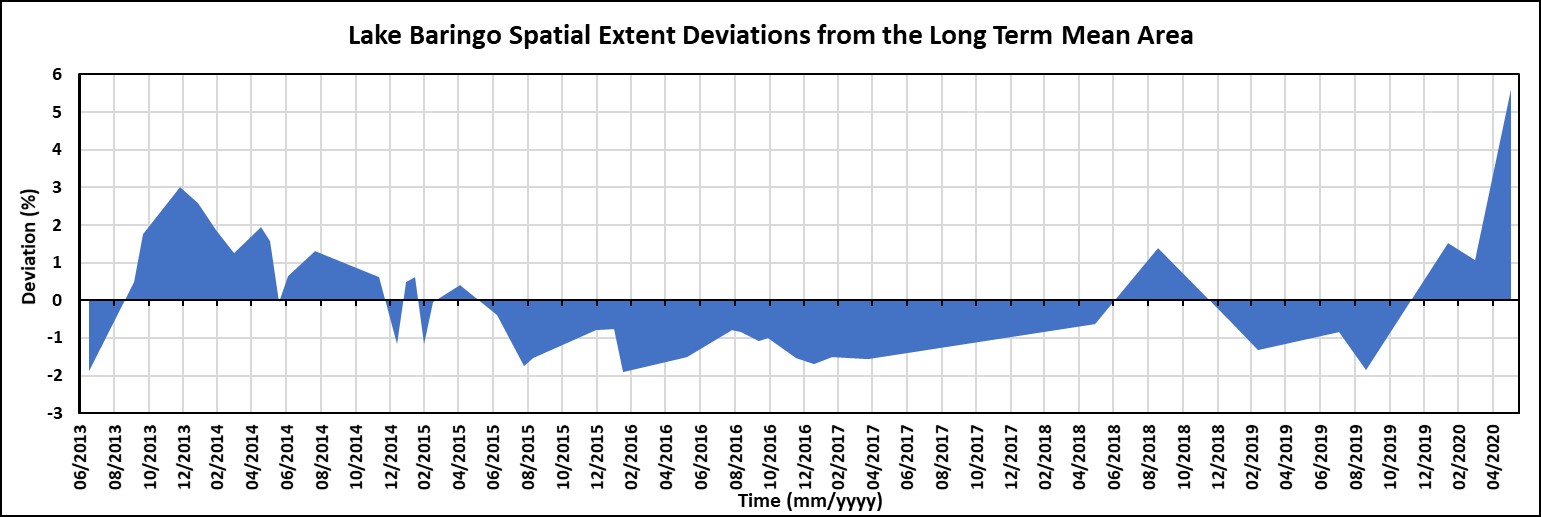
Figure 12: Anomalies of Lake Baringo’s surface area
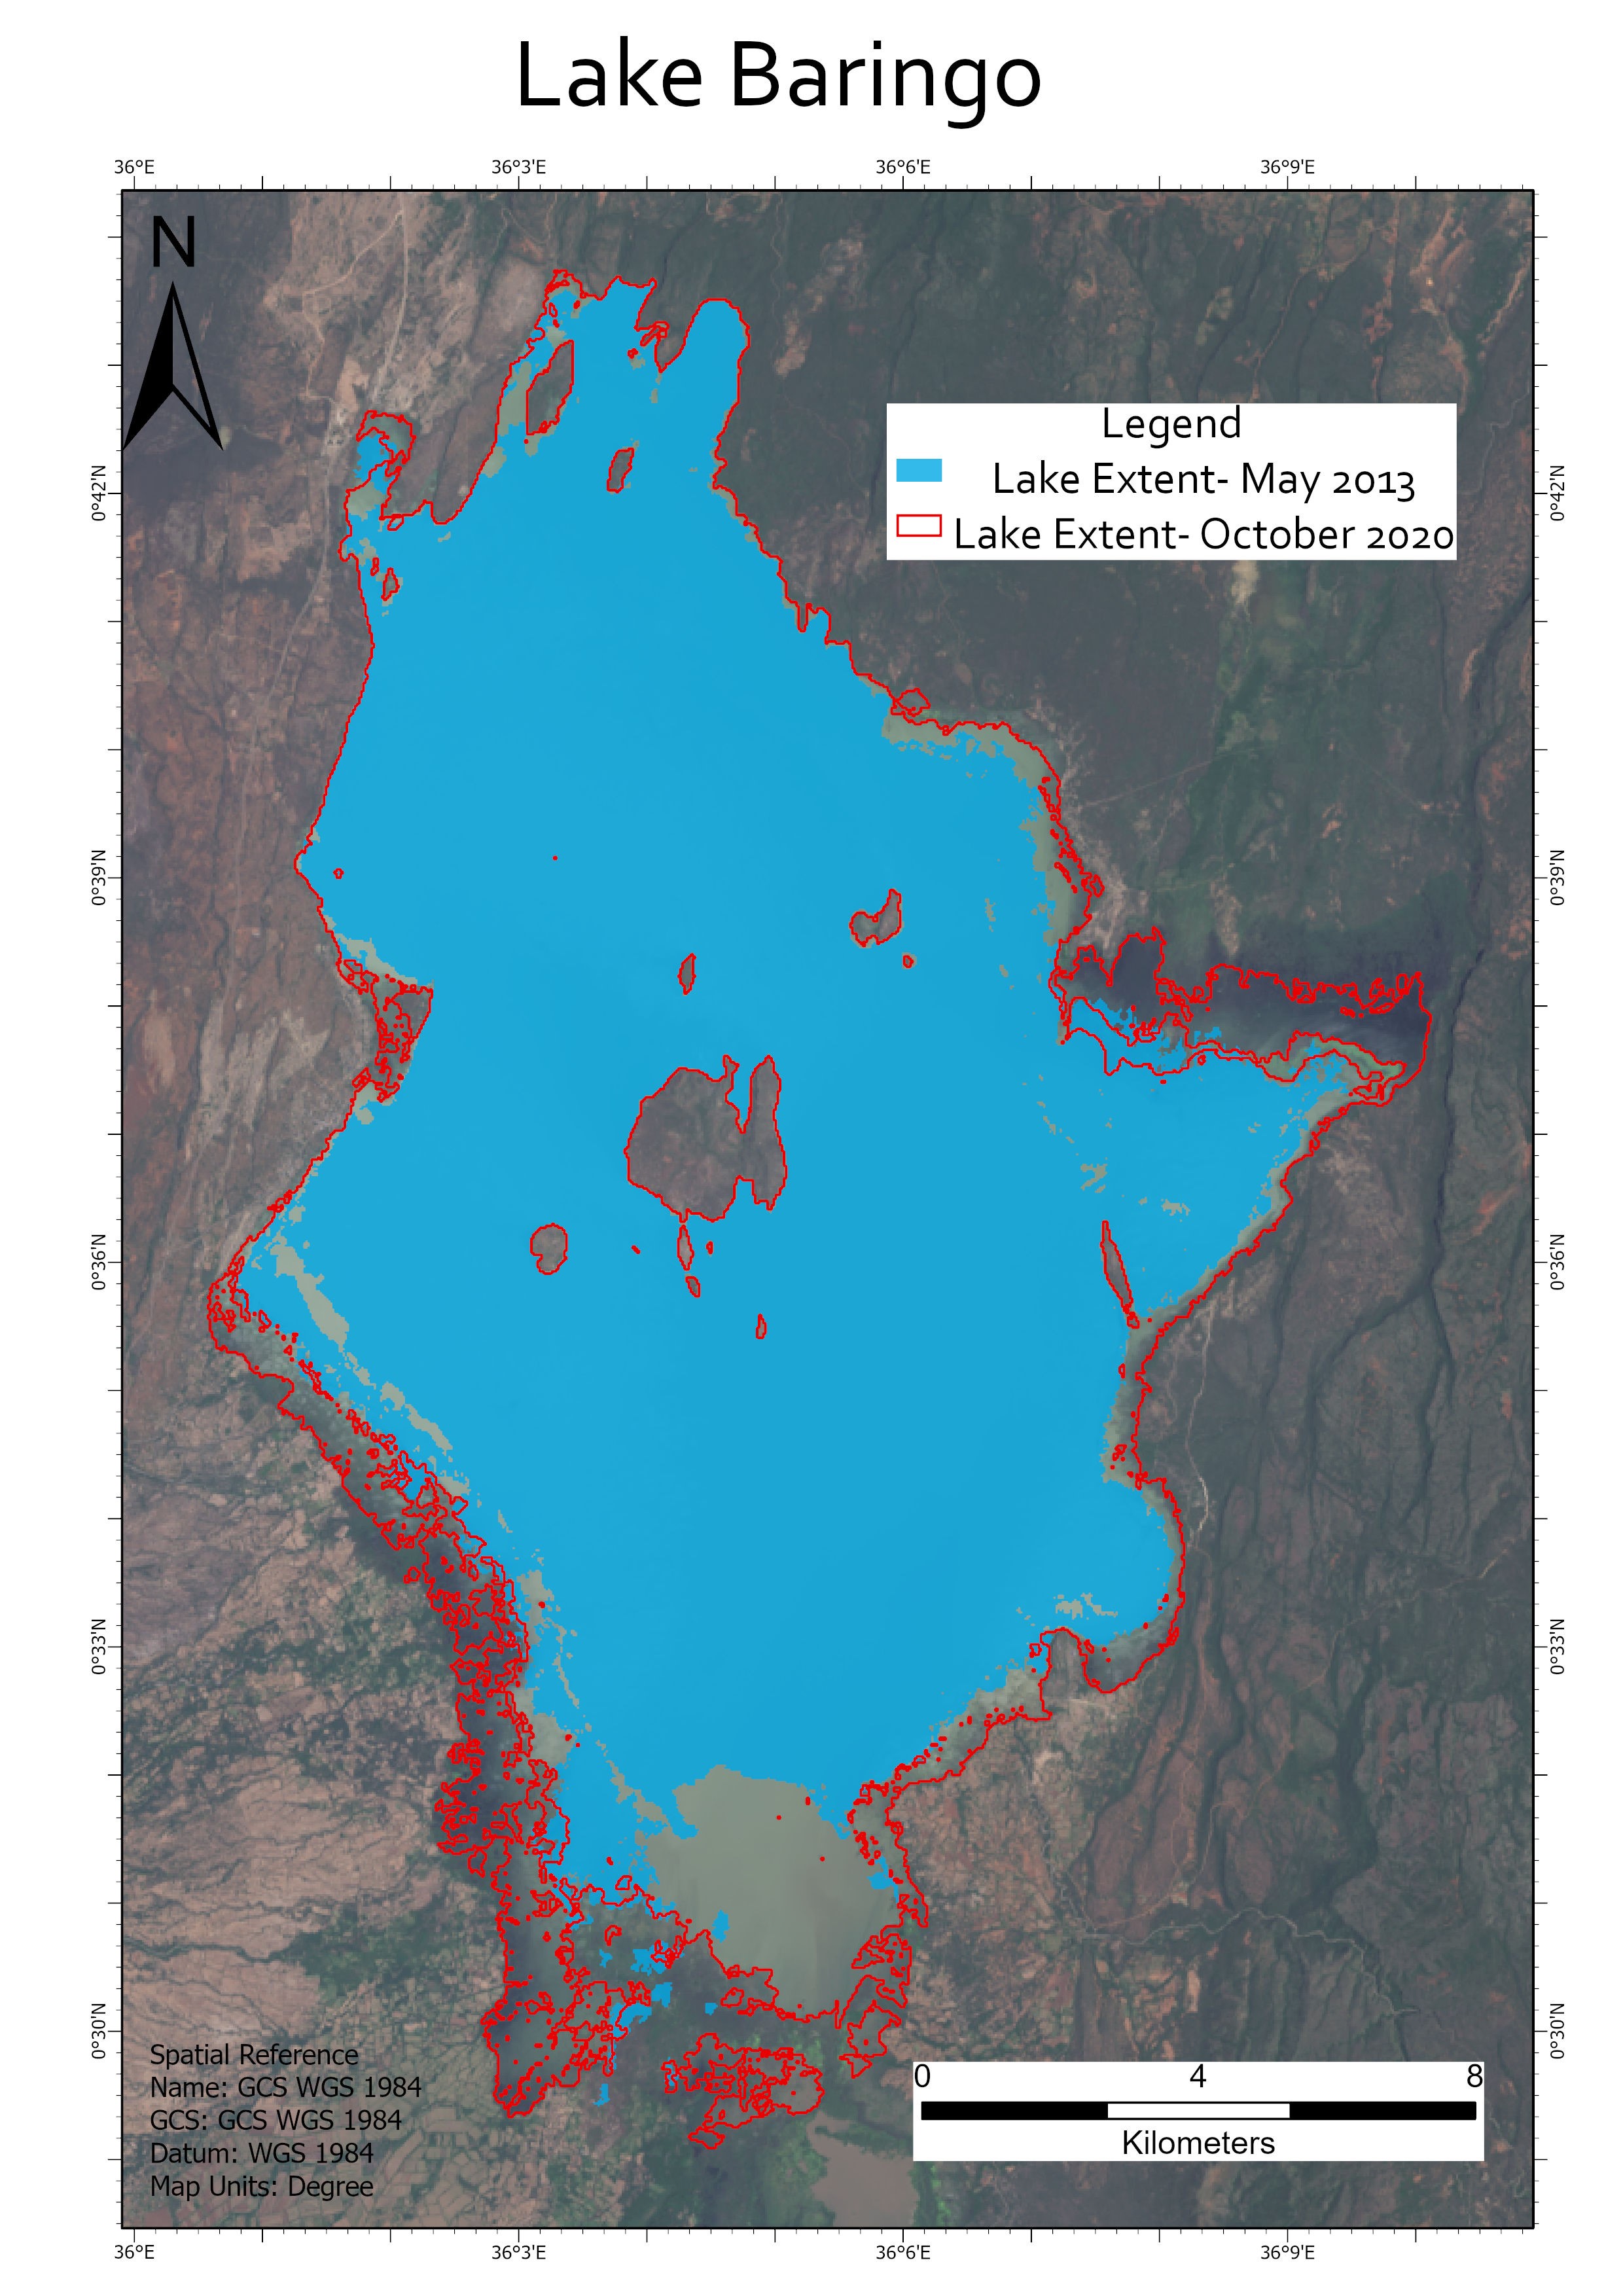
Figure 13: Images showing the variation of the area extend between May 2013 and October 2020.
This is a minimal increment as compared to Lake Naivasha and Nakuru. In the southern part, the shoreline extends by about 3.5km from the 2013 baseline. While Lake Bogoria is extending northward, Lake Baringo is extending southward hence reducing the distance between the two neighboring lakes that used to be about 20km before 2013 and now less than about 17 km apart.
It is noted that the increase in the lake extent coincides with increased rainfall over the catchment with 2018 and 2019 recorded 50% and 18% above normal respectively (Figure 14 and 15). The 2020 rainfall is already 19% above normal but with October-December is on the onset.
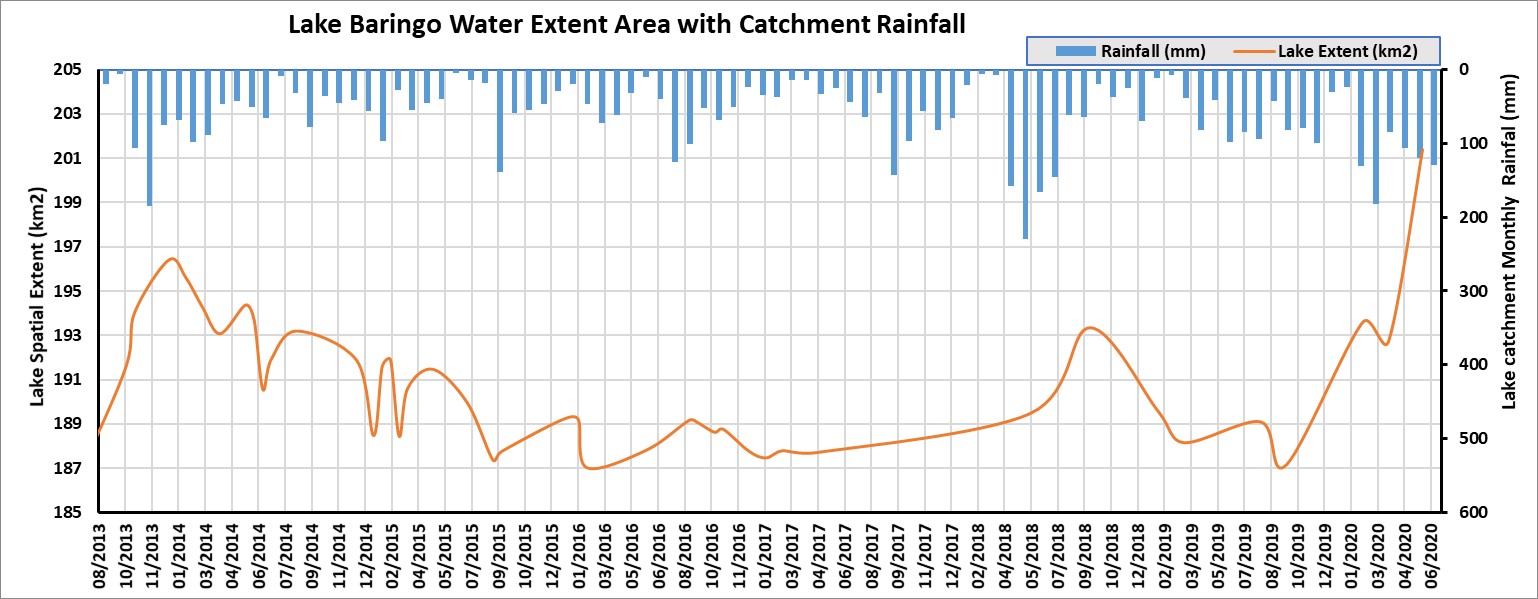
Figure 14 shows the trends of Lake Baringo’s surface area and catchment rainfall over time
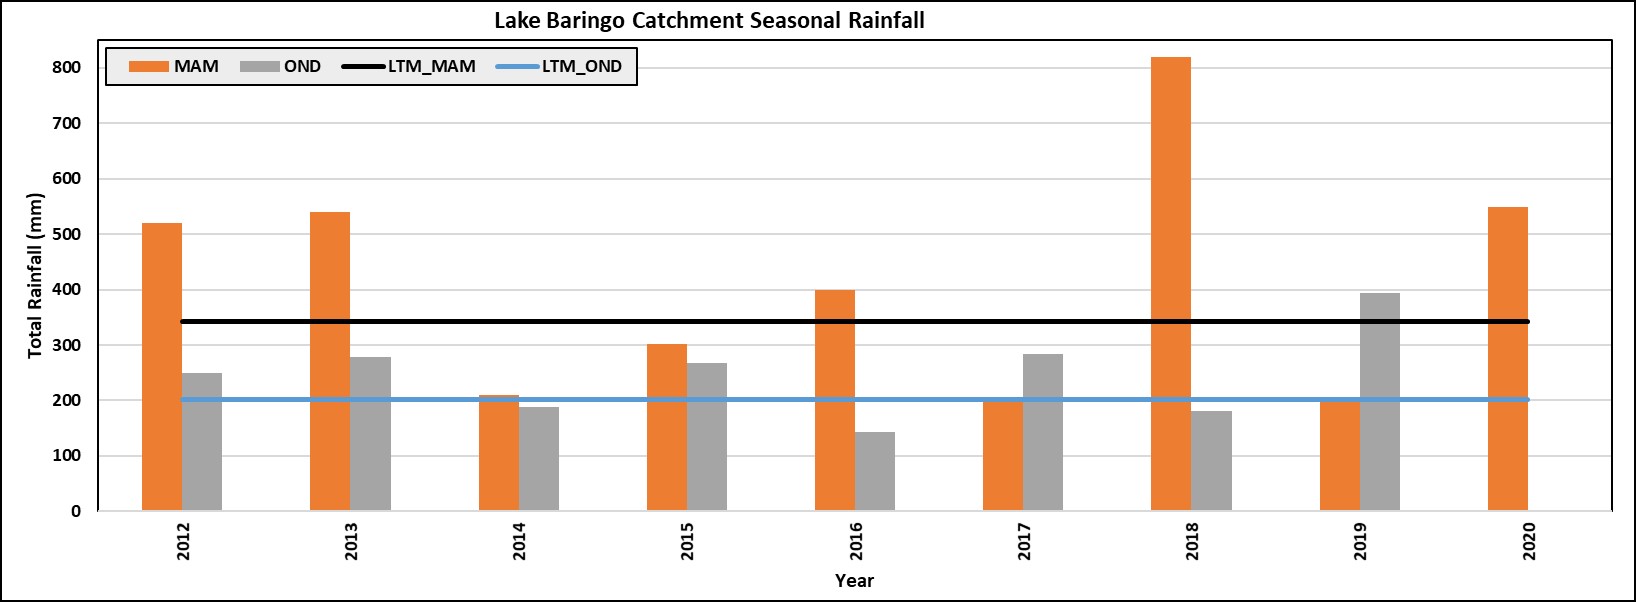
Figure 15: Seasonal Rainfall in Lake Bogoria Catchment (MAM- March-April-May; OND - October-November-December; LTM- Long Term Mean)
2.0 Conclusion and Recommendations
The increment in surface extent of the Rift Valley lakes were substantially from 2018 to 2020 compared to previous years. However, the trigger factors of the increment are still not certain despite the suggestive correlation with the increased rainfall over the lake catchments. Detailed investigation into the lake water balances, role of climatology, lake catchment land use change, land degradation and sediment yield into the lakes from the catchment as well as the role of geological activities including the status of the many geological fault and fissures in the region are key in understanding the underlying factors in the phenomenon. Given the vastness of the area, a combination of remote sensing and in-situ data will play a critical role in calibration of catchment-based lake balance model as well as validation of information in the region. The need to leverage on the strength and expertise of a number of relevant institutions is key to deriving a robust and objective outcome.


